Key Highlights: Navigating Q2 of 2025
- Equities: The S&P 500 surged +10.9% in Q2, recovering from an early 10% selloff driven by tariff headlines. Global equities followed suit, with emerging markets and Japan’s Nikkei posting double-digit gains.
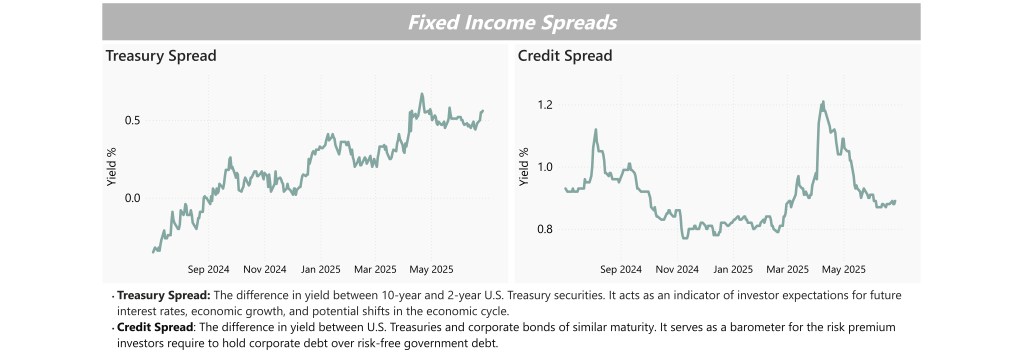
- Fixed Income: Treasury yields rose and the curve steepened, with the 10yr–2yr spread widening to +0.56%. Credit spreads tightened to 0.89%, reflecting a “risk-on” tone as investors leaned into corporate credit.
- Economics: Core inflation softened and the labor market held firm, helping ease recession fears. Futures continue to price in potential Fed rate cuts by year-end, despite upward pressure on long-term rates.
Economics, Equities, and Fixed Income
Q2 was marked by significant volatility, yet asset markets ultimately delivered strong returns. The quarter began with a sharp selloff after the U.S. announced sweeping reciprocal tariffs—most notably 34% on Chinese imports—causing the S&P 500 to fall more than 10% in just two days. Yields spiked as long-term Treasuries sold off, with the 30-year yield briefly surpassing 5%.2 However, markets rebounded swiftly after President Trump delayed tariff implementation by 90 days. From there, investor sentiment improved on the back of a strong April jobs report and a surprise easing of tariffs between the U.S. and China. The S&P 500 recovered to hit a new record high, finishing the quarter up +10.9%, while the MSCI Emerging Markets Index gained +12.2%, its best quarter since late 2020.1


In fixed income, long-end Treasury yields rose in Q2, driven largely by growing fiscal concerns—including a U.S. credit downgrade by Moody’s and the narrow House passage of a bill to extend Trump-era tax cuts. Despite upward pressure on yields, U.S. Treasuries still posted a +0.8% total return, supported by softer inflation readings and increasing expectations for Fed rate cuts later this year. The yield curve steepened meaningfully, with the 10-year minus 2-year spread rising to +0.56%, not due to growth optimism, but because of concerns around rising Treasury issuance, long-term inflation risks, and a repricing of term premium. Credit markets, however, reflected a more constructive tone—spreads tightened to 0.89% in June, indicating a clear “risk-on” sentiment as investors grew more comfortable owning corporate debt. Meanwhile, the U.S. Dollar fell -7.0% during the quarter, marking its worst first-half performance since 1973.1
What This Means for Portfolios
For investors, the second quarter highlighted the importance of remaining diversified. That includes not only asset class exposure but geographic exposure both in the US and internationally. The strength in equities and credit markets reflected improving sentiment, but rising long-term interest rates and a steepening yield curve signal deeper concerns around fiscal policy and inflation. In this environment, portfolios should be positioned to balance risk and opportunity—combining quality equity exposure with flexible fixed income strategies and alternative investments that can add resilience and return potential. As markets continue to digest policy shifts and macro uncertainty, maintaining exposure across asset classes and being selective within credit and interest rate risk will be essential to long-term outcomes.
1 Allen, Henry and Jim Reid. “June and Q2 2025 Performance Review.” Deutsche Bank Research, July 1, 2025.
2 “Markets Daily: June 1 – June 30, 2025 Series.” Bloomberg, June 1 – June 30, 2025.
IMPORTANT DISCLOSURE: This article is produced by Ceva Capital LLC dba Ceva Advisors. The information contained in this report is informational and intended solely to provide educational content to our clients and other readers that we find relevant and interesting. Opinions expressed are just that, and are current only as of the data of publication Nothing in this document should be construed as investment advice; we provide advice on an individualized basis only after understanding your circumstances and needs. The information presented in this newsletter is based on reports from Deutsche Bank and Bloomberg’s ‘5 Things You Need to Know to Start Your Day’ series. Data provided comes from sources we believe are reliable, but accuracy is not guaranteed. Discussion of sectors and the performance of region-specific equities and bonds generally refers to market indices. We use the S&P 500 to represent US large-cap; the Willshire Small Cap to represent US small-cap; the MSCI ACWI ex US to represent international equities; the US 10-year Treasury Yield to represent US Treasuries; the ICE BofA European Government Bond Index to represent European bonds; the ICE BofA US Corporate Index Effective Yield to represent investment-grade bonds; the ICE BofA US High Yield Index Effective Yield to represent high-yield bonds. Indices are unmanaged, are not subject to investment management fees or transaction costs, and it is not possible to invest in an index. Index performance can provide general information about how a particular region or investment has performed, but does not provide information about the performance of Ceva’s client portfolios. Actual client performance may differ materially from the index performance discussed. Past performance is not a guarantee of future results. Financial planning is a tool that can help clients consider different current and future scenarios and construct portfolios designed to meet specific goals and address specific risks. Financial planning does not guarantee a positive outcome or prevent loss. It’s important to revisit financial plans and the underlying assumptions of those plans regularly, and to make adjustments as needed to respond to changing circumstances.